elliottwave 9月27日波浪建议
In the bigger picture, we're working with the bearish case that an important short term top is in place at 1.2588 and that prices are working back down to challenge the 1.1870 support. On the bottom chart, you can see that it looks like a wave (i) decline is bottoming. If prices can stay on top of the 'red' downtrend line now near 1.2076, it will make a strong argument that a wave (ii) corrective rally toward the 1.2111-1.2171 area is underway and will precede a wave (iii) decline toward 1.1870. Key near-term support is at 1.2018, and a drop under there would make a strong case that the wave (iii) decline is underway. Key resistance is obviously the 1.2268 peak.
Little to add since yesterday. Clearly a move up through1.2130 would have to be viewed more constructively, but it
is hard to get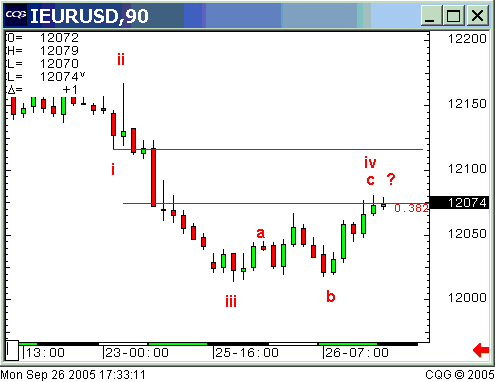 eu0926.gif
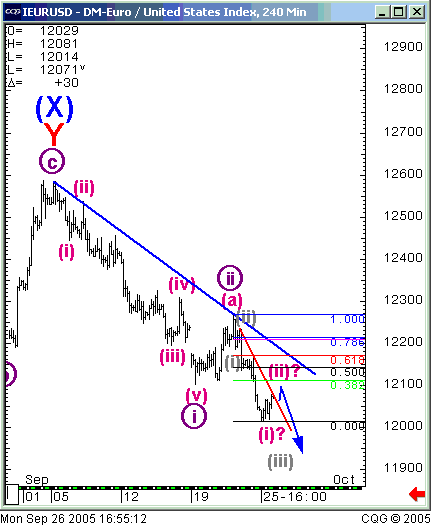 eur-intraday5.gif
 eu0926.gif
 eur-intraday5.gif
发表于:2005-09-27 00:29只看该作者
2楼
好啊,谢谢老兄
韬客外汇论坛TALKFOREX.COM
3楼
So far it is unclear if this break is impulsive. The EU is hanging very firm so watch the Fibo support area near 1.7740, which is
very close to the DAILY FIBO retracement...
The count continues virtually unchanged off yesterday's exhaustion gap and bottom. Prices have pushed past the initial target of 1.7781 but not dramatically. A push up through 1.7850 would be suggestive that a wave of larger degree has finished.
[ 本帖最后由 cicadas 于 2005-9-27 09:26 编辑 ]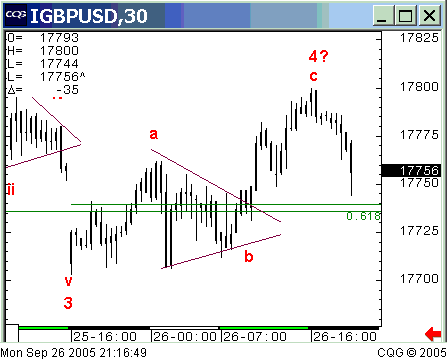 bp0926b.gif
 bp0926b.gif
4楼
Prices are struggling to leave the confines of the apparent down channel which has contained most of the price action of the current decline. So far there appears to be no impulse action to the upside, although it is possible that the anticipated wave 4 consolidation/rally could be underway
Yesterday's range was very small, and given the bearish nature of the daily chart, perhaps some short covering above yesterday's high might be in order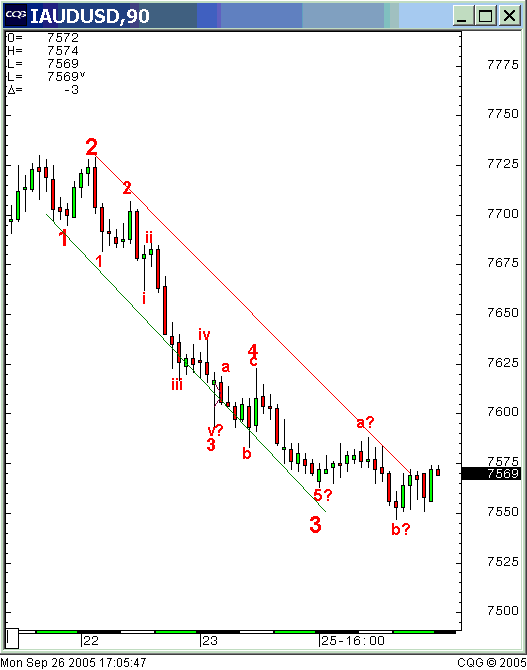 au0926.gif
 au0926.gif
发表于:2005-09-27 00:34只看该作者
5楼
楼主照顾大多数,请用中文,谢谢。
韬客社区www.talkfx.co
发表于:2005-09-27 01:06只看该作者
6楼
thanks
财富来自投资者心灵深处平静自制的勇气
7楼
Resistance is now 1.2067 and the first possible support is at the .618 retracement around 1.2040. If this decline is impulsive, new lows are likely for a possible bottom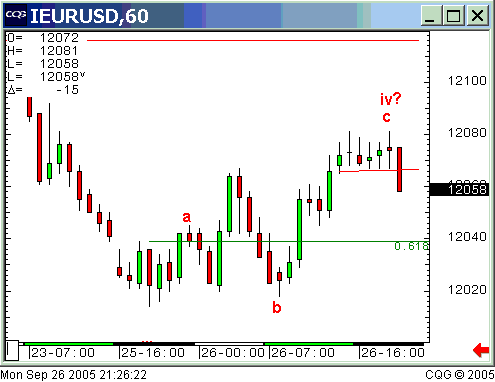 eu0926b.gif
 eu0926b.gif
发表于:2005-09-27 01:34只看该作者
8楼
谢谢!不过有点看不懂英文。
发表于:2005-09-27 01:38只看该作者
9楼
没看明白:')
10楼
Prices are struggling to leave the confines of the apparent down channel which has contained most of the price action of the current decline. So far there appears to be no impulse action to the upside, although it is possible
that the anticipated wave 4 consolidation/rally could be underway...
Yesterday's range was very small, and given the bearish nature of the daily chart, perhaps some short covering above yesterday's high might be in order...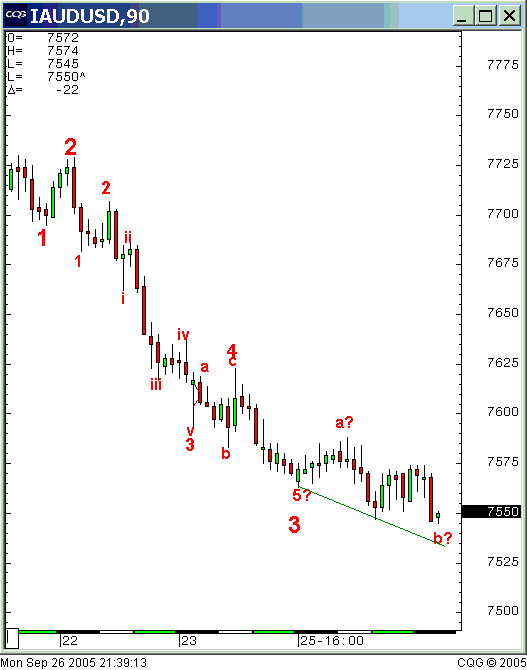 au0926a.gif
 au0926a.gif
发表于:2005-09-27 01:51只看该作者
11楼
谢谢
韬客社区www.talkfx.co
12楼
EURUSD: The wave iii (circled) structure down from 1.2269 is indicating the possible formation of an extended third wave pattern within the structure and suggests some more selling to come. Keep the view to the lowside towards 1.1950-30, while immediate resistance at 1.2081 holds.
GBPUSD: Moving lower in a possible wave (iii) of iii (circled) formation, the Cable should test 1.7620-10 in the near-future, while 1.7799 remains intact
AUDUSD: With prices still edging downward, watch for the AUDUSD to drop a bit further towards projected support at 0.7520-02 before a wave c formation from 0.7730 gives way to an upward test of 0.7574-82. However, a break below 0.7502 would suggest still lower impulsive prices to come (to another test of 0.7457) after a possible upward correction
发表于:2005-09-27 09:32只看该作者
13楼
楼主可能生活在国外!;P;P
to learn knowledge and to make money
14楼
If we're in a third wave decline, there should be steady movement lower toward 1.7620-10, with the 'red' downtrend line near 1.7727 intact. The next support zone under 1.7610 is at 1.7563-36. Though less-likely, sustained trading above 1.7727 would argue that the wave (ii) is still alive as an irregular flat, which would bring the 1.7800 peak back into play. ...Greg Pyron...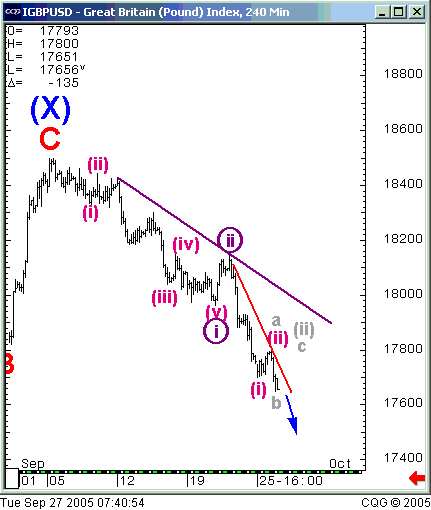 gbp-intraday.gif
 gbp-intraday.gif
15楼
looking for this fourth wave consolidation from .7532 to be followed by another leg down toward a projected support area at 0.7520-02 before a downward wave 'c' formation from 0.7730 is complete. A break above 0.7582 and 0.7608 would suggest a short-term low had been formed. However, any fall below 0.7502 would indicate still lower impulsive prices to come (to another test of 0.7457) after a possible upward correction. ...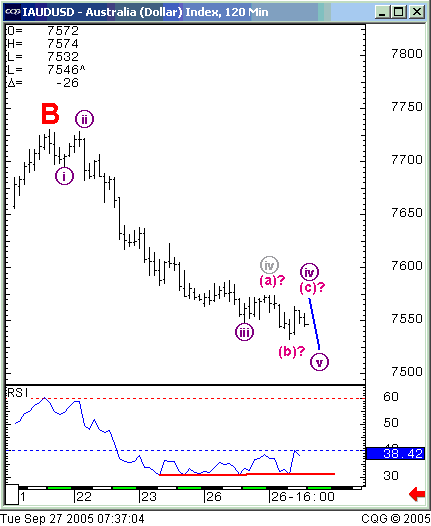 aud-intraday.gif
 aud-intraday.gif


